15 Exercises II
15.1 Exercises 3: Using vectors
E3.1 Bmi2
Add a return value advice_text to the Bmi2 function we drafted in the lecture. The value of advice_text should be chosen from one of the four character strings below according to bim_value:
- “below 18.5 – you’re in the underweight range”
- “between 18.5 and 24.9 – you’re in the healthy weight range”
- “between 25 and 29.9 – you’re in the overweight range”
- “between 30 and 39.9 – you’re in the obese range”
E3.2 ||, |, &&, &
Execute the following code snippet and answer the two questions in the comment:
E3.3 table
Given t <- table(c("apple", "banana", "coconut", "apple", "apple", "banana")) 1. What is the base type of t? 2. What attributes are associated with t? 3. What do you know about each of t’s attributes? 4. Which attribute(s) does t share with a matrix?
E3.4 apply
The runif function generates a vector of uniformly distributed random numbers within a given interval. For example, runif(10, min = 2, max = 3) returns 10 random numbers between 2 and 3.
- With the help of this function, create a 1000 x 6 matrix of uniformly distributed values between
5and6. - Calculate the 6 column-wise averages of the 1000 x 6 matrix without using a for loop.
15.2 Exercises 4: Using data.frame
E4.1 SumPrimes
Problem 10, Project Euler: The sum of the primes below 10 is 2 + 3 + 5 + 7 = 17. Find the sum of all the primes below two million. Use the sieve of Eratosthenes algorithm.
E4.2 data()
How many datasets are available via the data() command?
E4.3 VADeaths
The VADeaths dataset that comes with R base records the death rates per 1000 in Virginia in 1940:
- What is the average death rate in the 55-59 age group in 1940?
- Which population group has the highest death rate in the 60-64 age group?
E4.4 WorldPhones
The WorldPhones dataset that comes with R base contains the number (in thousands) of telephones in various regions of the world:
- What is the total number of phones in year 1961?
- What is the year on year increase rate in phone usage in Asia from 1957 to 1958?
- Where did the highest year on year increase happen from 1951 to 1961? and when?
- Which year did Asia see the biggest increase rate in phone usage?
E4.5 airquality
The airquality dataset that comes with R base gives the daily air quality measurements in New York, from May to September 1973:
- What is the average wind speed in New York in August 1973?
- Is there any dates missing from this dataset? (Are all dates from May to September 1973 in this dataset?)
- Which day in May had the highest solar radiation?
- Which variable (each column contains values/observations of a variable) has the most number of missing values?
E4.6 Indometh
The Indometh dataset (built-in to R base) has 66 rows and 3 columns of data on the pharmacokinetics of indometacin of 6 subjects. Reshape it to a wide format.
E4.7
A simulation was run for a period of 10 years. Each year is assumed to be 365 days ignoring leap years. A row of data is written to an output csv file for each day of the simulation. (i.e. the output file has 3650 rows of data) The days column of this csv is a sequence of ascending integers from 9126 to 12775, with 9126 representing 2022-Jan-01, 12775 representing 2031-Dec-31. Our task now is to extract from this file, rows that represent the first day of each month, i.e. 2022-Jan-01, 2022-Feb-01, 2022-Mar-01, … 2031-Dec-01. For this purpose we need to construct a logical vector data_sel.
In the following script, let data_days represent the days column of the csv file.
- Construct a vector
data_selwhich is of equal length todata_dayswithdata_sel[ii]indicate whetherdata_days[ii]should be selected (data_sel[ii] == TRUE) or not (data_sel[ii] == FALSE). (Try do this without using anyfor/whileloops) - Check that
data_selhas 120TRUEvalues, with all the rest beingFALSE. How many ways (each using different functions) can you do this?
15.3 Exercises 5: Base R plotting
E5.1
Make a graph to illustrate the relation between Temp and Month in the airquality dataset.
E5.2
Make a graph to illustrate the relation between count and spray in the InsectSprays dataset.
E5.challenge 1: Unit circle
Reproduce this graph of a unit circle as much as you can: 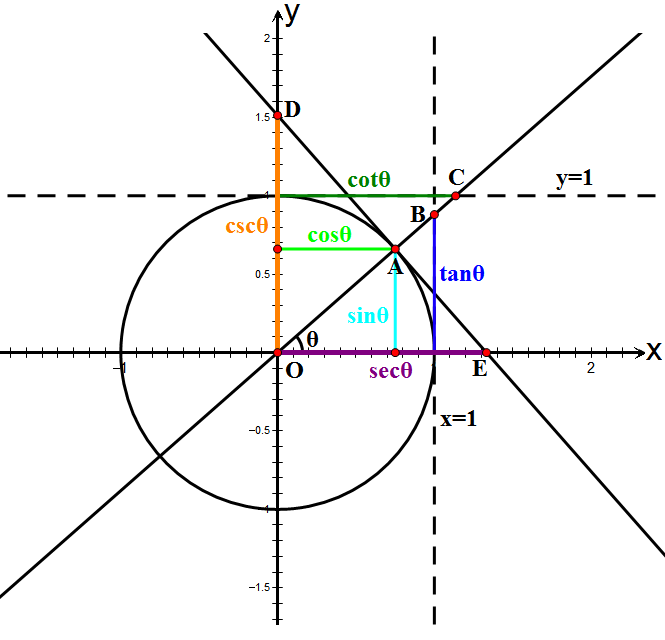
E5.challenge 2: The Datasaurus Dozen
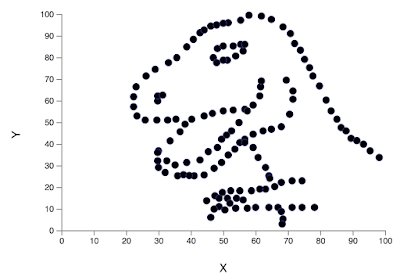
The Datasaurus Dozen is a modern adaptation of Anscombe’s Quartet. The Datasaurus dataset was originally proposed by Alberto Cairo to emphasis the importance of visualising data link. It was extended to the Datasaurus Dozen dataset and published on CHI’17. The dataset and its description is available via this link.
- Download the dataset using this link, and plot all 13 datasets with scatter plots in a 4 x 4 grid.
- Use the blank spaces of the 4 x 4 grid with plots of your choice to illustrate that whilst these datasets are indistinguishable by summary statistics, each dataset has its own distribution pattern.